

什么是累积值图表?
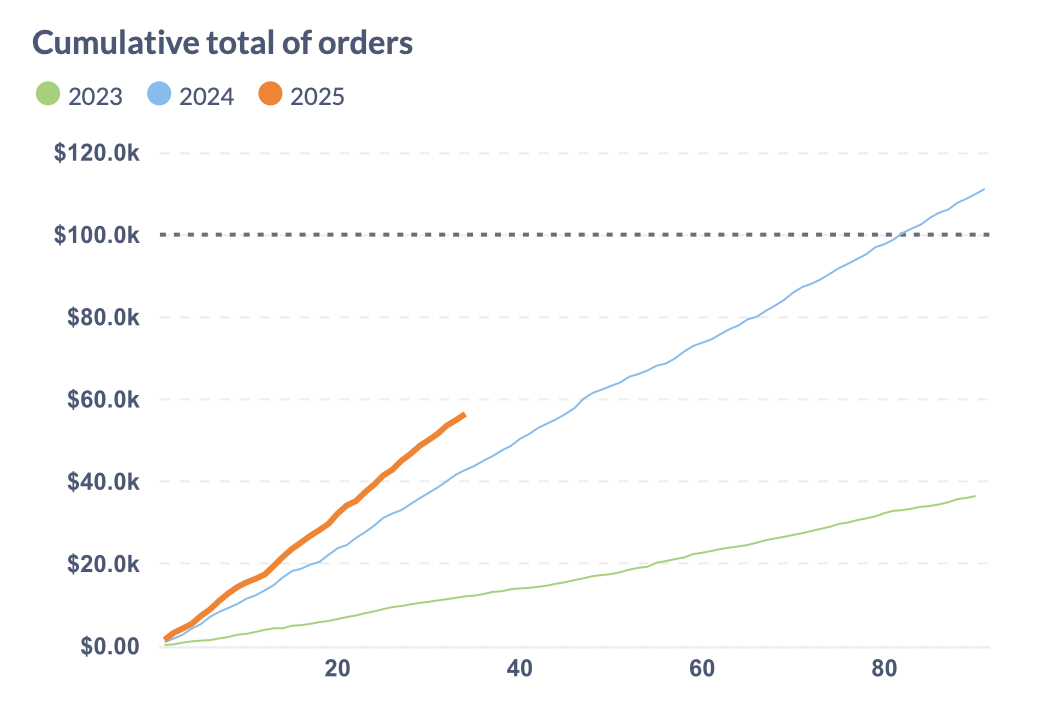
跟踪会随时间累积的值(例如销量、行驶里程等)是很常见的。与常规的折线图相比,累积值图表显示了每个时间点的总计,例如季度中的某一天。当添加的值更多时,该线会更陡峭;当添加的值很少(或没有)时,它会更接近水平。
累积值图表也适用于进行周期比较(例如与去年同期比较),以及显示数据线应该达到的目标。
跟踪会随时间累积的值(例如销量、行驶里程等)是很常见的。与常规的折线图相比,累积值图表显示了每个时间点的总计,例如季度中的某一天。当添加的值更多时,该线会更陡峭;当添加的值很少(或没有)时,它会更接近水平。
累积值图表也适用于进行周期比较(例如与去年同期比较),以及显示数据线应该达到的目标。
