

使用 Prometheus 进行可观察性
您可以从 Metabase 导出指标为 Prometheus 格式。
在本地运行 Metabase 和 Prometheus
为了让您了解 Metabase 和 Prometheus 如何在您的生产环境中协同工作,我们将逐步介绍如何在本地设置 Metabase 和 Prometheus。
使用 MB_PROMETHEUS_SERVER_PORT 启动 Metabase
下载最新的 Metabase JAR,然后使用环境变量运行 Metabase 来指定 Prometheus 服务器端口
MB_PROMETHEUS_SERVER_PORT=9191 java --add-opens java.base/java.nio=ALL-UNNAMED -jar metabase.jar
MB_PROMETHEUS_SERVER_PORT=9191 指定了 Metabase 将使用哪个端口(9191)将数据发送到 Prometheus。为了说明这里涉及的端口
- 端口
3000是 Metabase 用于提供 Metabase 应用的端口。您可以使用MB_JETTY_PORT设置另一个端口(例如,MB_JETTY_PORT=3001)。 - 端口
9191(或您使用MB_PROMETHEUS_SERVER_PORT环境变量指定的任何端口)是 Prometheus 用于从 Metabase 抓取指标的端口。 - 端口
9090是 Prometheus 用于提供 Prometheus 应用的端口。
当您启动 Metabase 时,Metabase 日志会告诉您 Metabase 正在启动 prometheus metrics collector 和 prometheus metrics web-server。
(truncated logs)
2022-09-01 17:47:38,808 INFO metabase.util :: Database setup took 3.4 s
2022-09-01 17:47:38,826 INFO metabase.core :: Setting up prometheus metrics
2022-09-01 17:47:38,827 INFO metabase.prometheus :: Starting prometheus metrics collector
2022-09-01 17:47:38,839 INFO metabase.prometheus :: Starting prometheus metrics web-server on port 9,191
(truncated logs)
您可以在 https://:3000 查看您本地运行的 Metabase。
下载并配置 Prometheus
下载 Prometheus,并解压文件。
进入 Prometheus 目录,添加以下 YAML 文件来配置您的 Prometheus
Prometheus 配置文件示例
global:
  scrape_interval: 15s # By default, scrape targets every 15 seconds.

  # Attach these labels to any time series or alerts when communicating with
  # external systems (federation, remote storage, Alertmanager).
  external_labels:
    monitor: "codelab-monitor"

# A scrape configuration containing exactly one endpoint to scrape:
# Here it's Prometheus itself.
scrape_configs:
  # The job name is added as a label `job=<job_name>` to any timeseries scraped from this config.
  - job_name: "prometheus"

    # Override the global default and scrape targets from this job every 5 seconds.
    scrape_interval: 5s
    # use whatever port here that you set for MB_PROMETHEUS_SERVER_PORT
    static_configs:
      - targets: ["localhost:9191"]
您需要将“target”更改为 Metabase 的位置,对于此特定示例,Metabase 与 Prometheus 运行在同一主机上(“localhost”)。
在本地运行 Prometheus
在 Prometheus 目录中的新终端进程中,运行
./prometheus --config.file=prometheus.yml
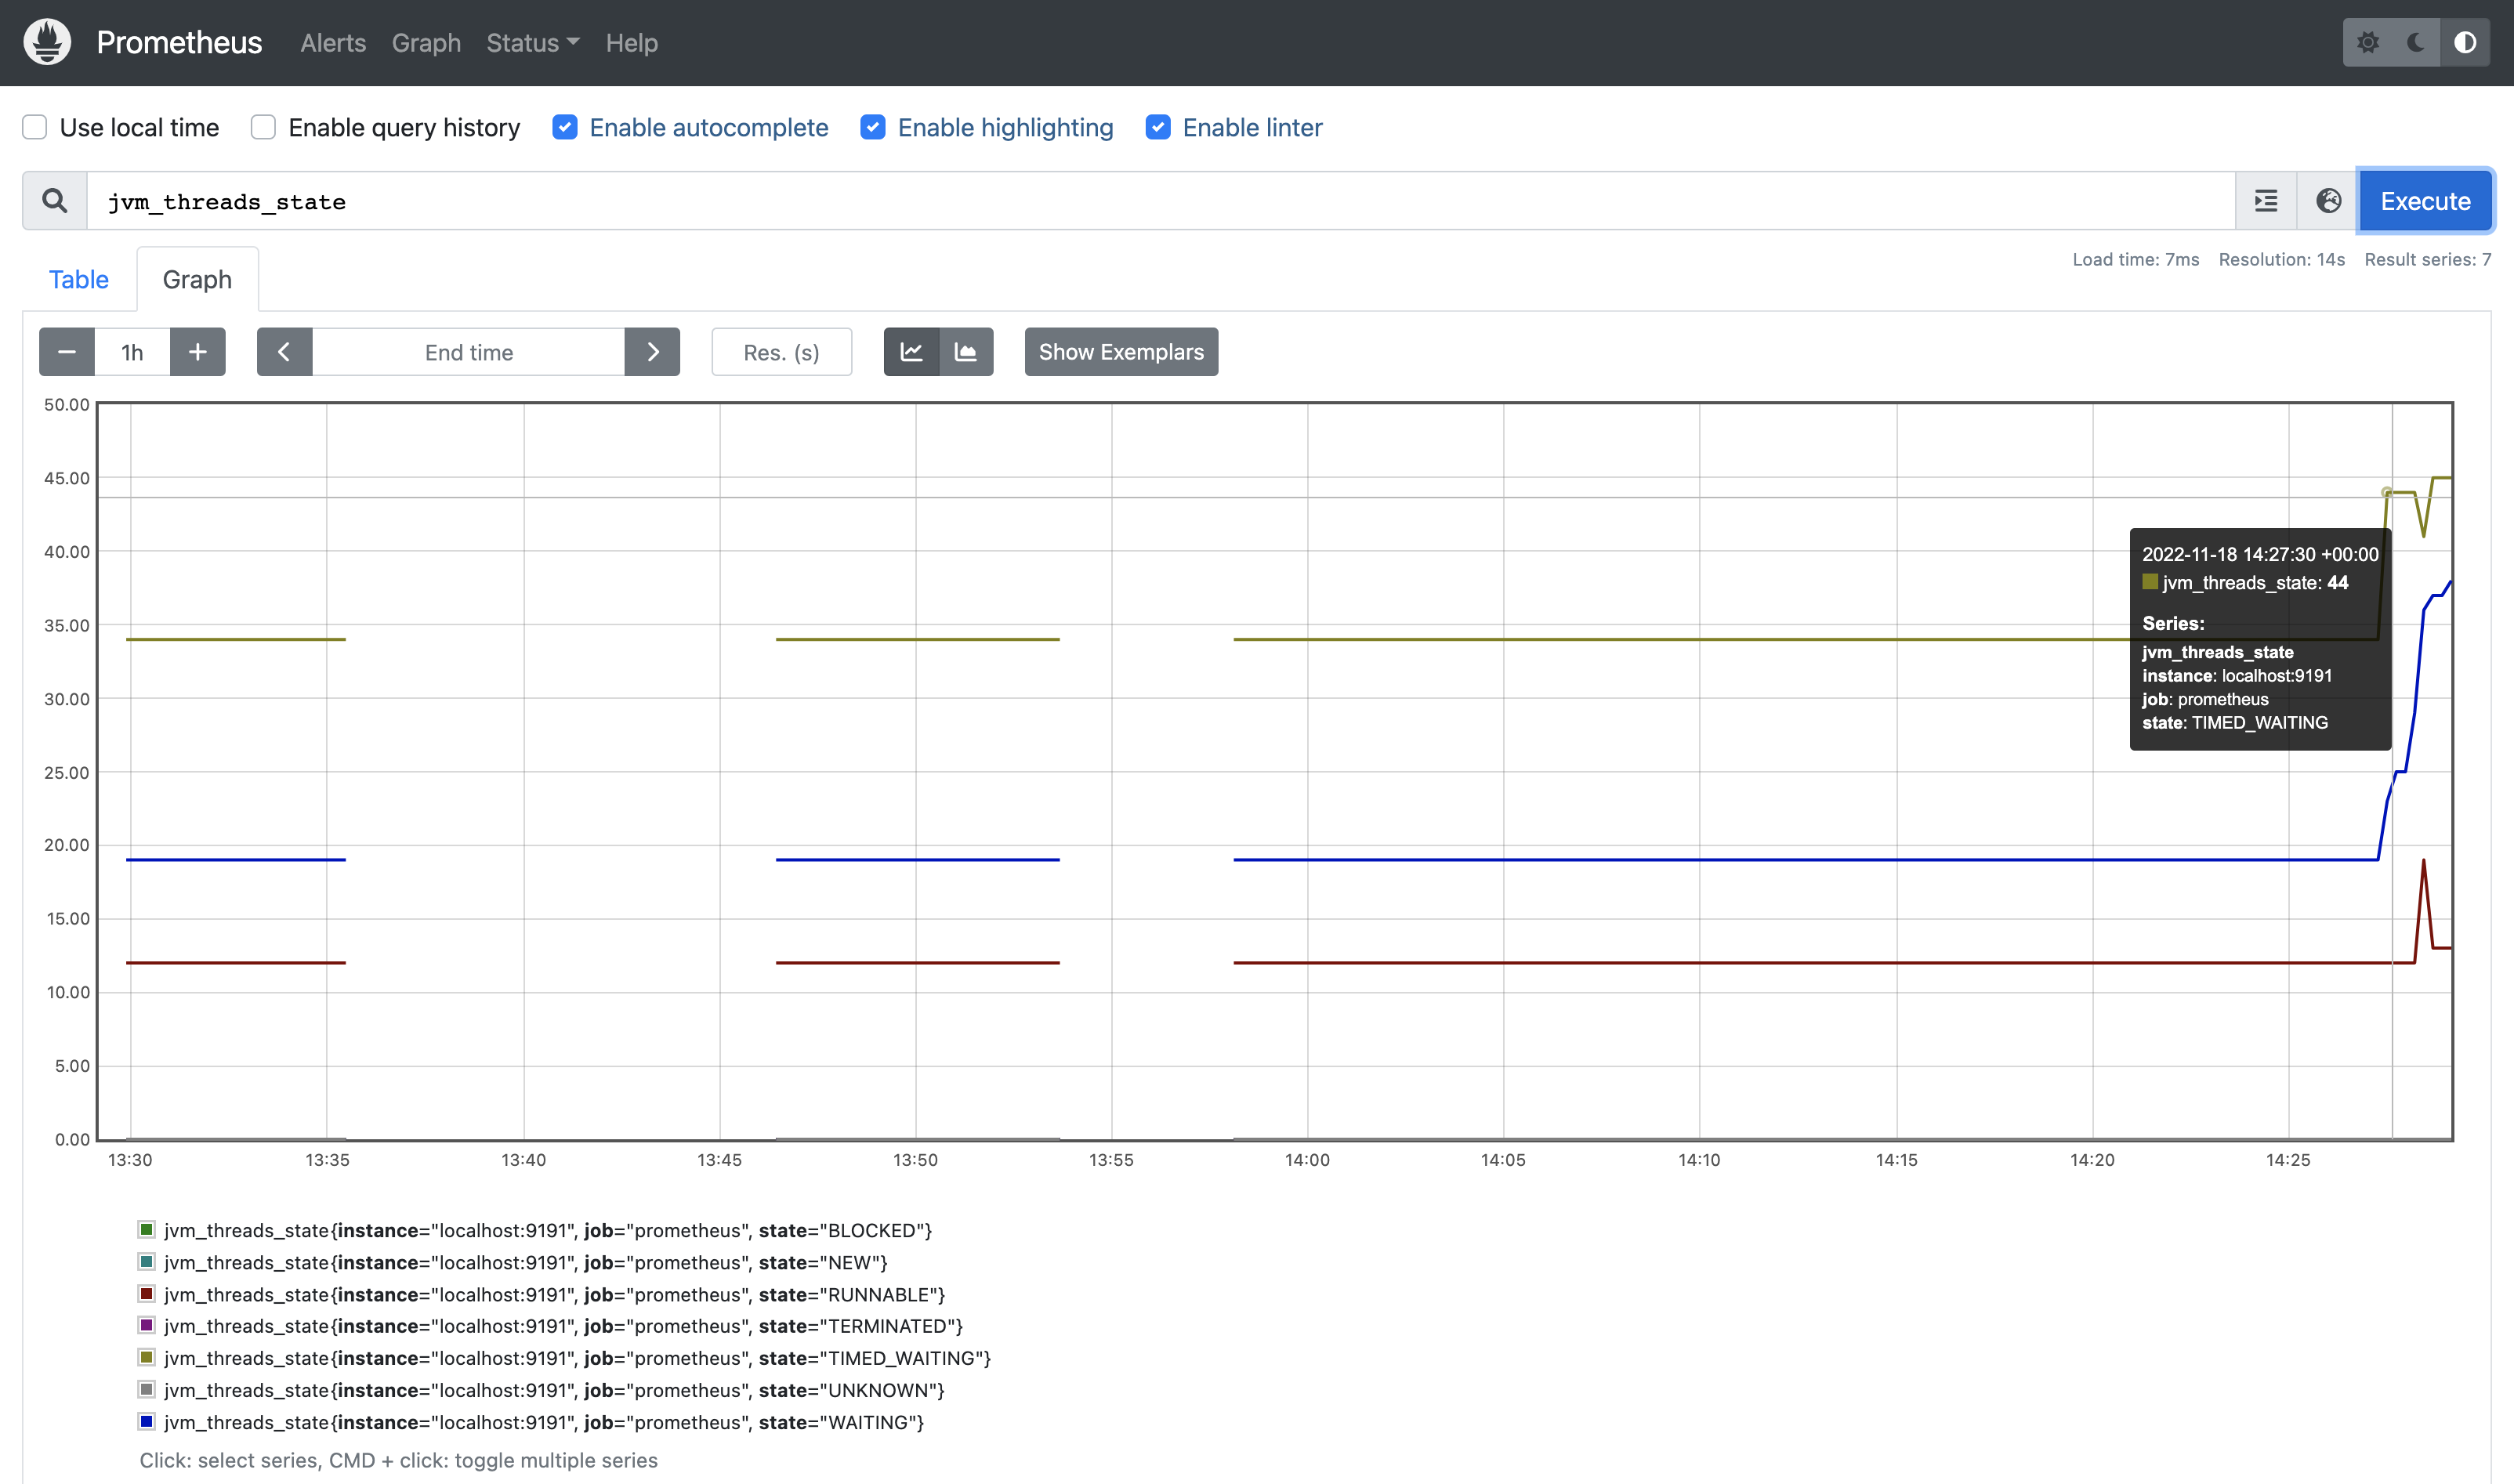
然后检查 https://:9090。您应该能看到 Prometheus 应用,并能够搜索 Metabase 发出的各种指标。
示例指标输出
这是 Metabase 的一些示例输出
'# HELP jvm_threads_current Current thread count of a JVM
'# TYPE jvm_threads_current gauge
jvm_threads_current 81.0
'# HELP jvm_threads_daemon Daemon thread count of a JVM
'# TYPE jvm_threads_daemon gauge
jvm_threads_daemon 36.0
'# HELP jvm_threads_peak Peak thread count of a JVM
'# TYPE jvm_threads_peak gauge
jvm_threads_peak 81.0
'# HELP jvm_threads_started_total Started thread count of a JVM
'# TYPE jvm_threads_started_total counter
jvm_threads_started_total 104.0
'# HELP jvm_threads_deadlocked Cycles of JVM-threads that are in deadlock waiting to acquire object monitors or ownable synchronizers
'# TYPE jvm_threads_deadlocked gauge
jvm_threads_deadlocked 0.0
导出的指标
Metabase 导出的指标包括
c3p0_max_pool_sizec3p0_min_pool_sizec3p0_num_busy_connectionsc3p0_num_connectionsc3p0_num_idle_connectionsc3p0_num_threads_awaiting_checkout_default_userjetty_async_dispatches_totaljetty_async_requests_totaljetty_async_requests_waitingjetty_async_requests_waiting_maxjetty_dispatched_activejetty_dispatched_active_maxjetty_dispatched_time_maxjetty_dispatched_time_seconds_totaljetty_dispatched_totaljetty_expires_totaljetty_request_time_max_secondsjetty_request_time_seconds_totaljetty_requests_activejetty_requests_active_maxjetty_requests_totaljetty_responses_bytes_totaljetty_responses_totaljetty_stats_secondsjvm_gc_collection_seconds_countjvm_gc_collection_seconds_sumjvm_memory_bytes_committedjvm_memory_bytes_initjvm_memory_bytes_maxjvm_memory_bytes_usedjvm_memory_objects_pending_finalizationjvm_memory_pool_bytes_committedjvm_memory_pool_bytes_initjvm_memory_pool_bytes_maxjvm_memory_pool_bytes_usedjvm_memory_pool_collection_committed_bytesjvm_memory_pool_collection_init_bytesjvm_memory_pool_collection_max_bytesjvm_memory_pool_collection_used_bytesjvm_threads_currentjvm_threads_daemonjvm_threads_deadlockedjvm_threads_deadlocked_monitorjvm_threads_peakjvm_threads_started_totaljvm_threads_stateprocess_cpu_seconds_totalprocess_max_fdsprocess_open_fdsprocess_start_time_secondsprocess_virtual_memory_bytesmetabase_email_messages_totalmetabase_email_messages_createdmetabase_email_message_errors_totalmetabase_email_message_errors_created
延伸阅读
阅读其他版本的 Metabase 的文档。