漏斗图
使用漏斗图显示步骤的进展。
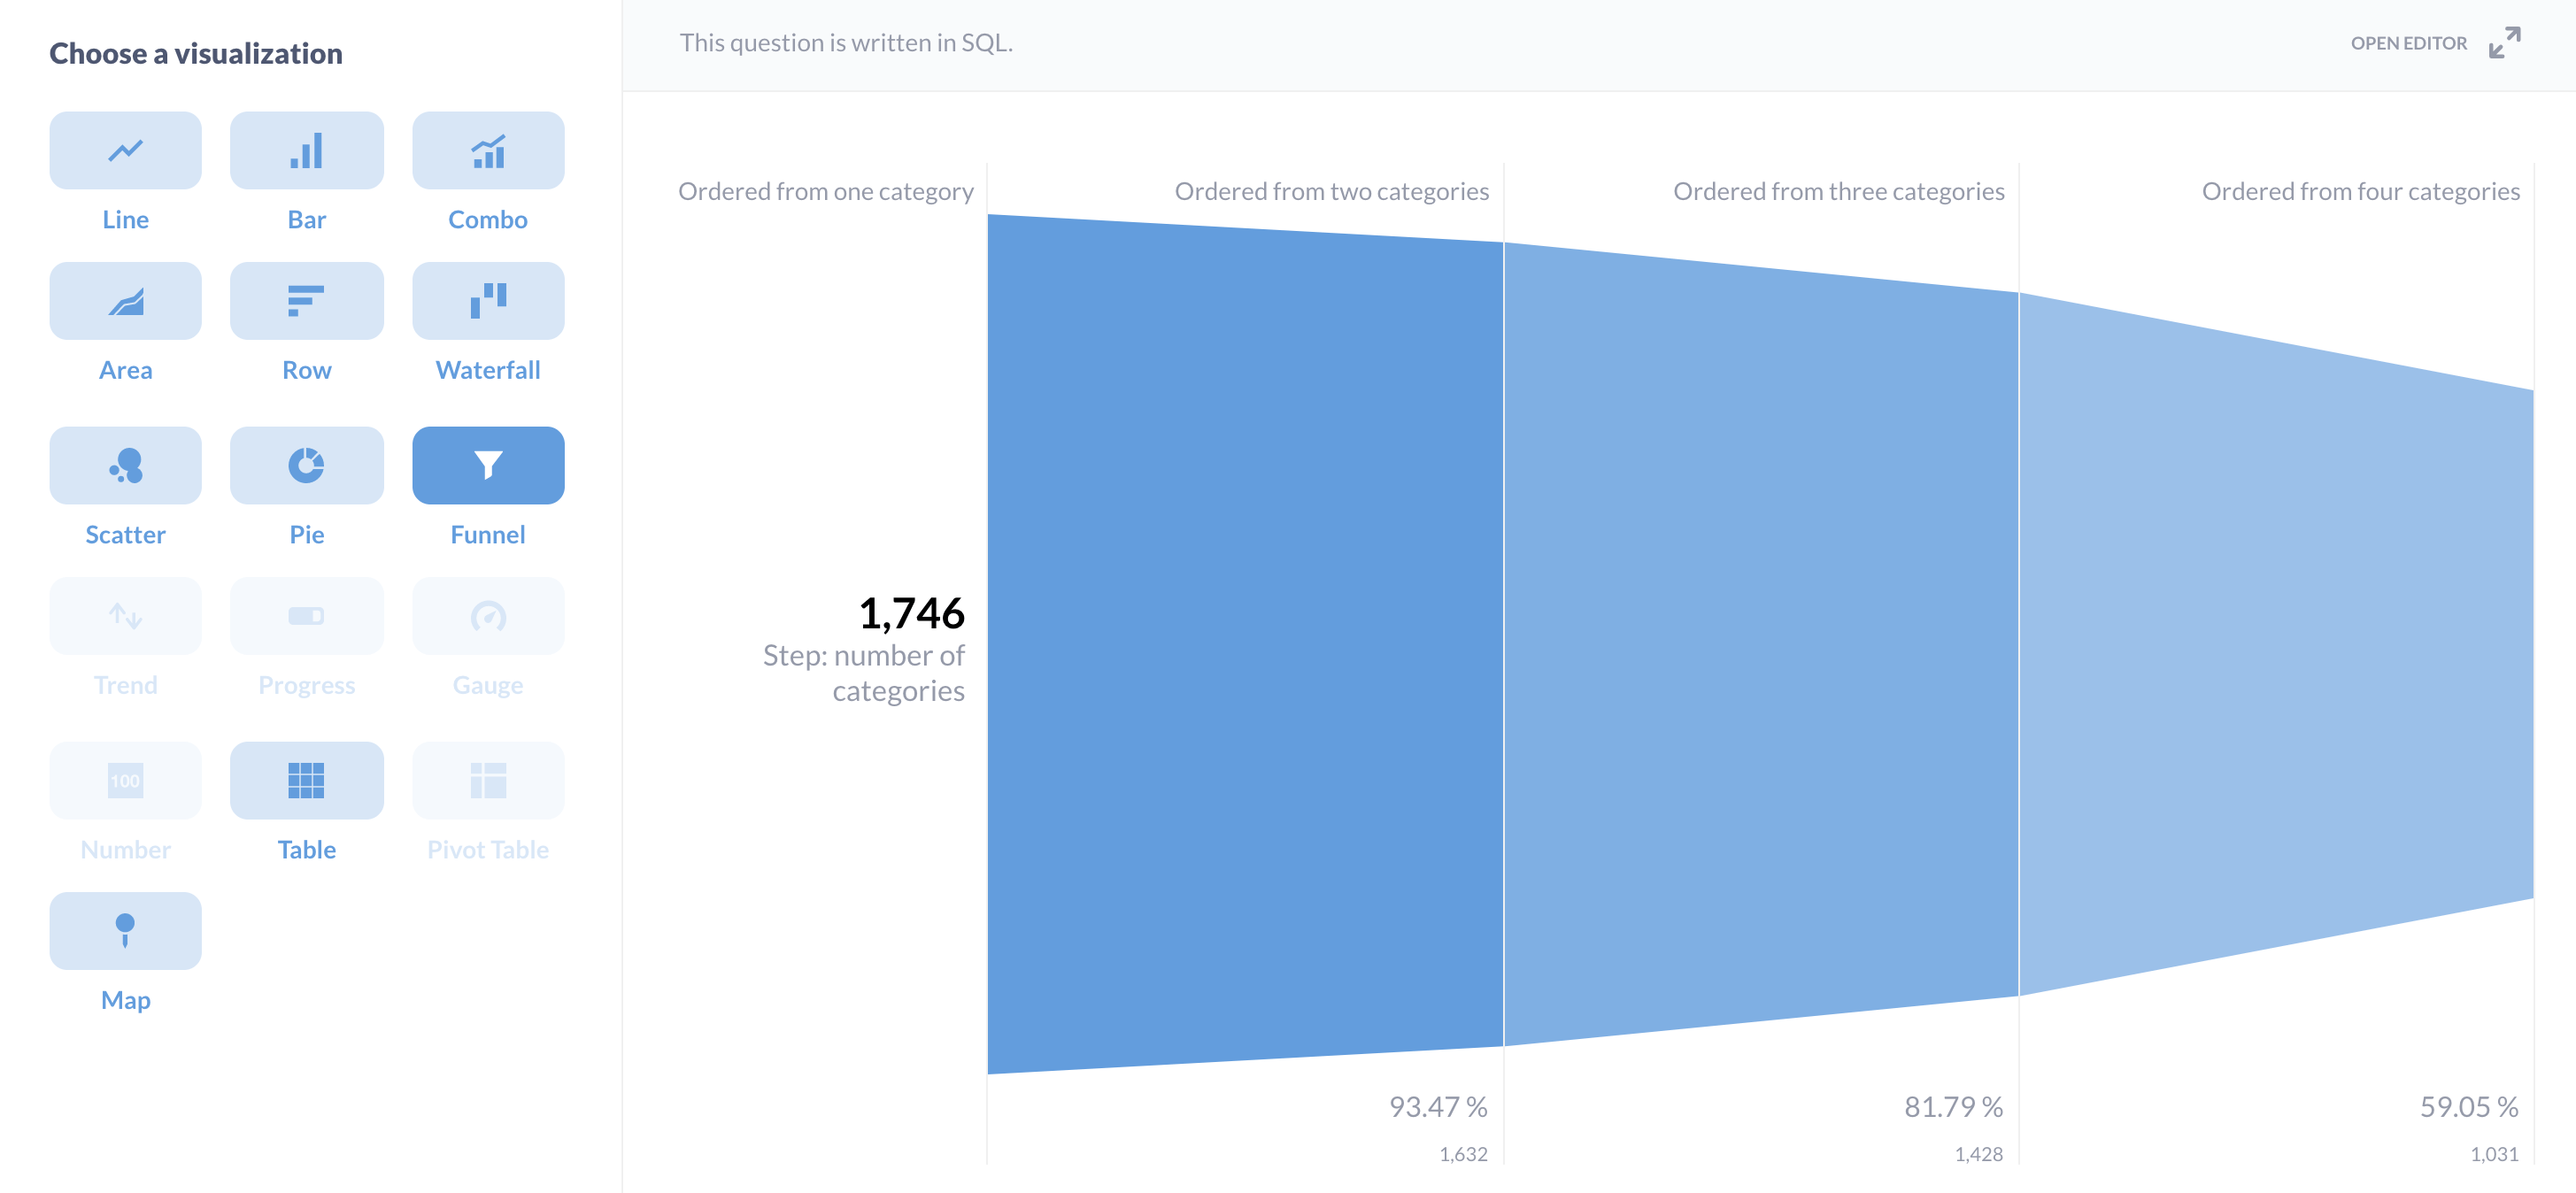
漏斗图可视化**度量**如何在**步骤**系列中分解。通常,它们用于显示有多少人完成了特定序列,例如网站上的结帐流程。第一步(或关卡)将是有多少人访问了您的网站。然后有多少人查看了产品页面(步骤 2),有多少人将该商品添加到购物车(步骤 3),等等。
我们将逐步介绍如何使用安装随附的示例数据库在 Metabase 中构建漏斗图,以便您可以跟随操作。我们将在查询构建器和 SQL 编辑器中展示示例。
示例数据库不包含事件;它只有四个包含订单、产品和客户信息的表。因此,我们必须在这里发挥一点创意,才能提出漏斗图的示例。
使用查询构建器的漏斗图示例
这是一个虚构的例子。我们将假装我们漏斗中的步骤是产品类别(因为我们的示例数据库中没有任何类似状态或页面或其他进展)。这是我们的查询的笔记本视图。
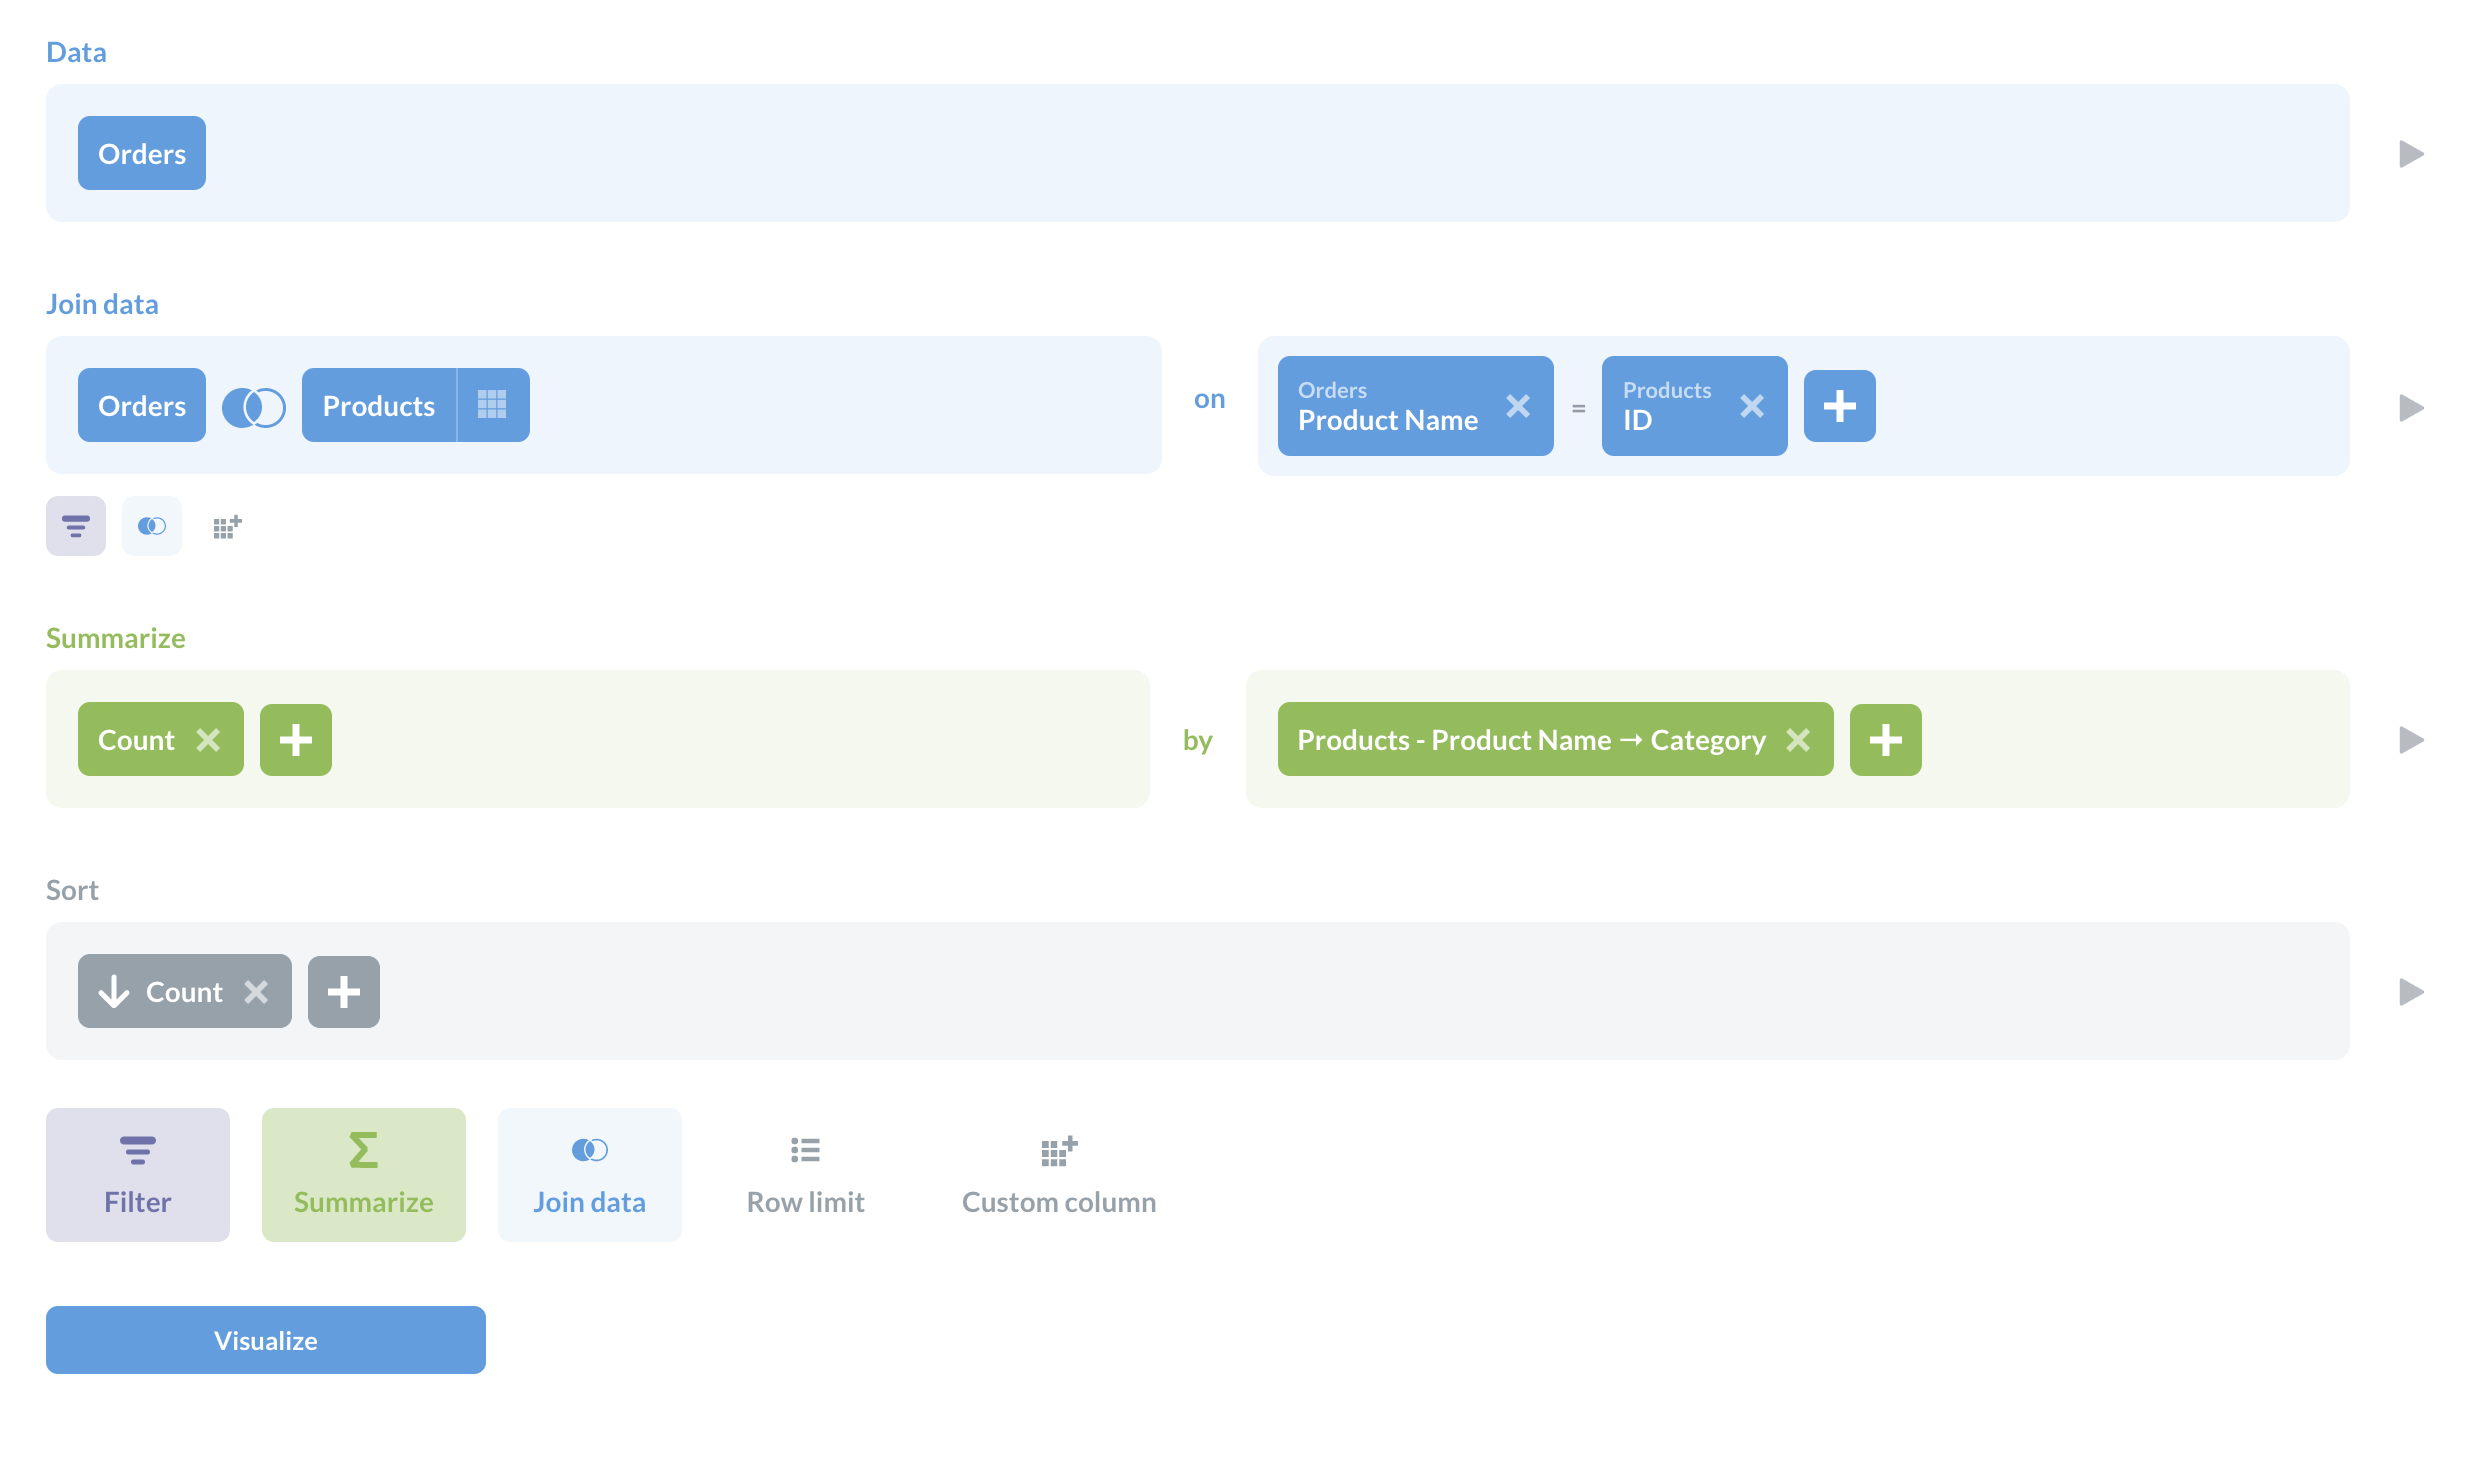
我们所做的是连接了 Orders 和 Products 表格(请参阅Metabase 中的连接),汇总了订单计数,并按产品类别对这些计数进行了分组。然后,我们按计数降序对结果进行了排序。要获得漏斗图,我们在左下方点击了可视化,然后选择了漏斗。在漏斗图的设置中,在数据选项卡下,您可以设置步骤(在本例中,我们使用的是产品类别)和度量(订单计数)。
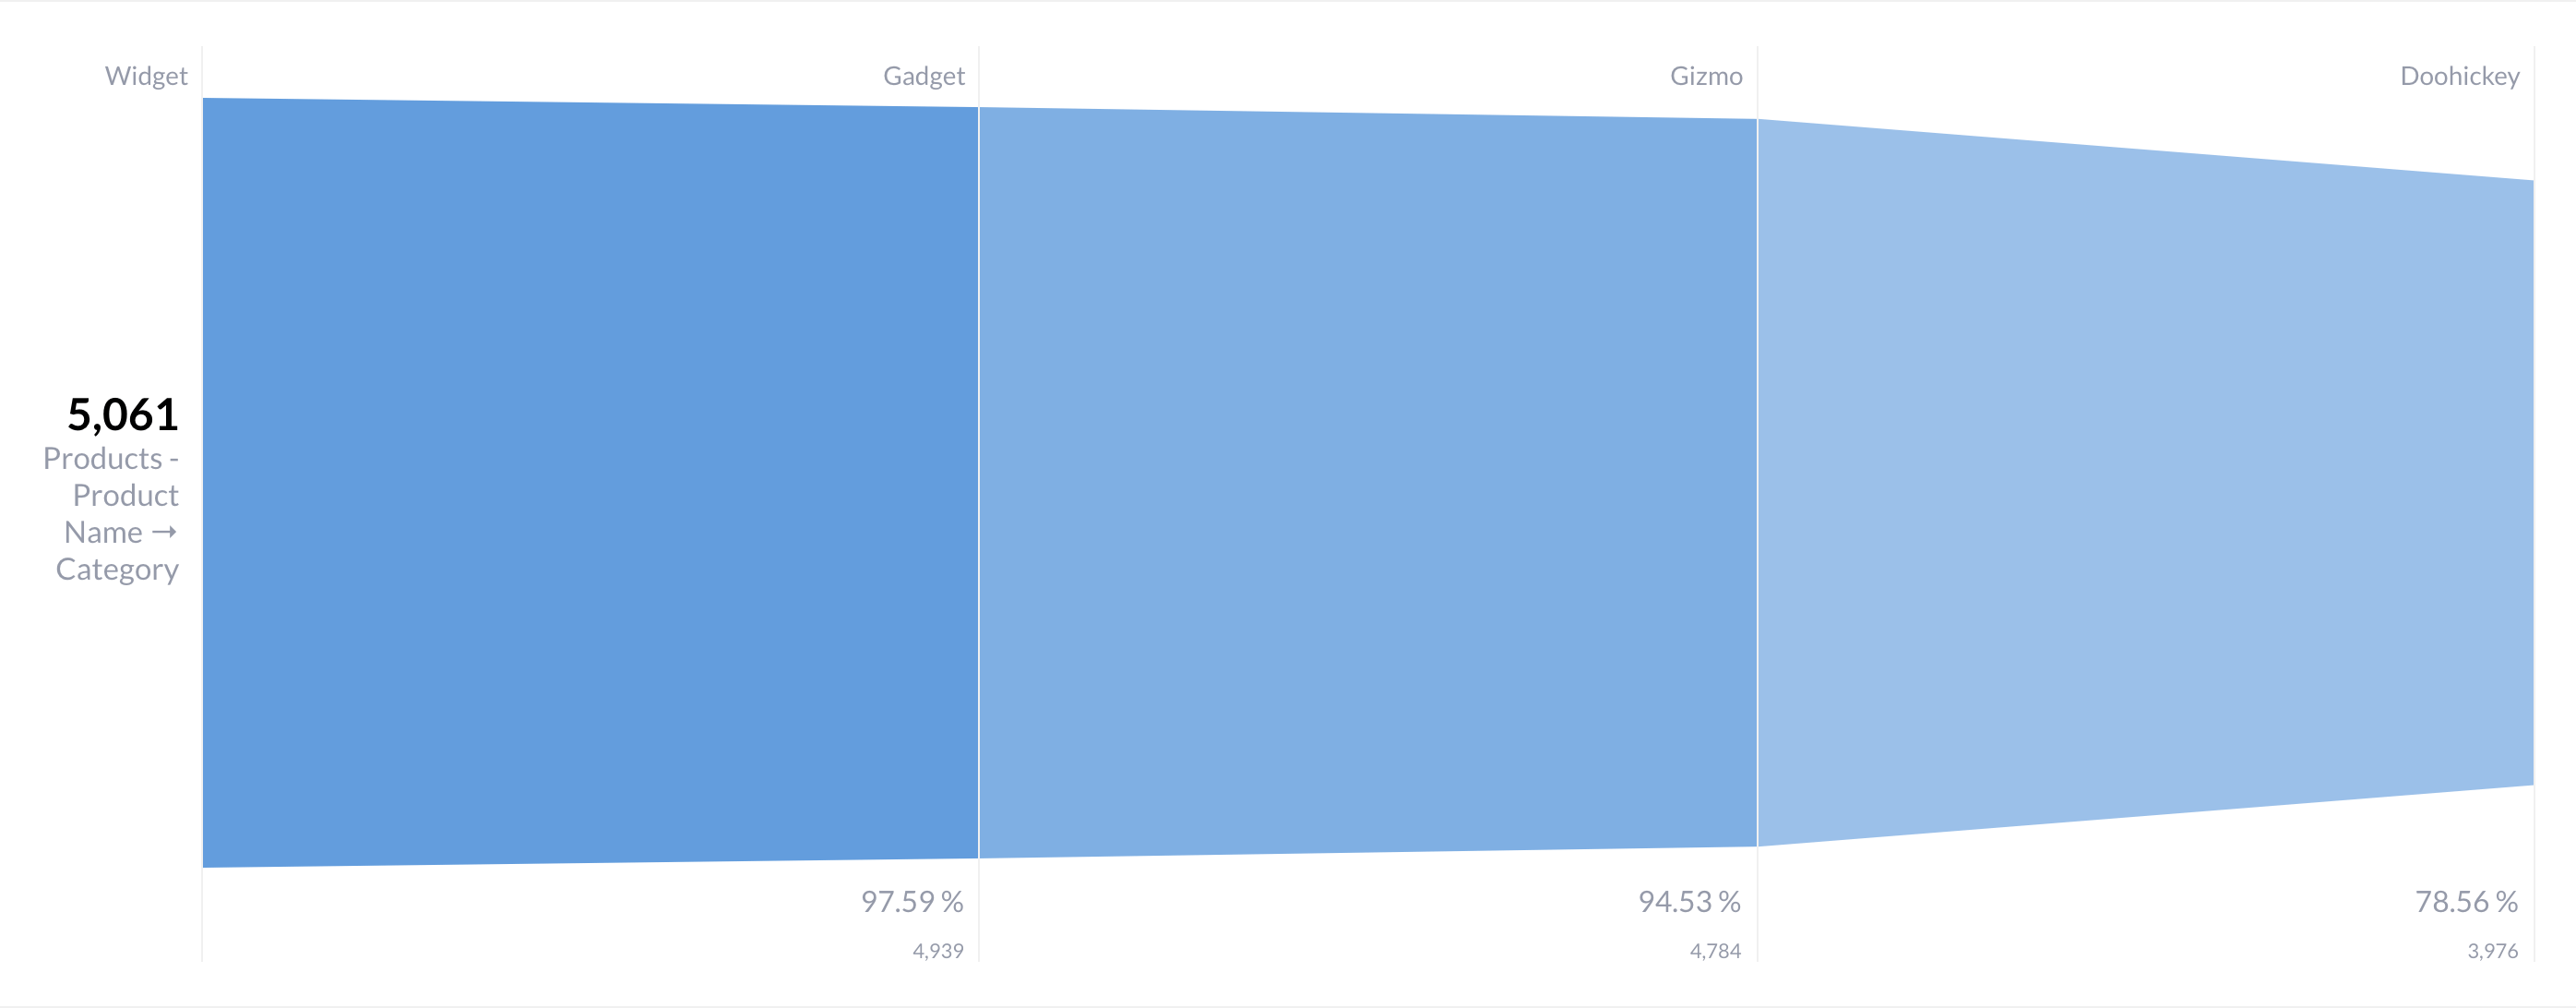
请注意,在 设置 -> 显示 选项卡中,您可以将 漏斗类型 更改为“条形图”,这是表示数据的另一种有效方法。漏斗图的优势(除了视觉隐喻之外)在于 Metabase 还会显示度量在每个步骤中通过的百分比。
使用自定义列保持步骤排序
如果每个步骤中的计数没有自然减少,您可能需要手动对步骤进行排序,以保留步骤的实际进展。例如,如果您在连续的步骤中具有相同的计数,则步骤可能会在漏斗图中被交换,例如 Metabase 默认按字母顺序对步骤进行排序以打破平局。同样,如果您的漏斗在某些步骤中可以增加计数(例如,新用户中途进入漏斗),则漏斗将默认为降序计数,这将搞乱您的步骤顺序。
在这些情况下,您可以创建一个额外的列来编号步骤,并按步骤排序以强制执行正确的漏斗顺序。以上面的查询为例,我们可以修改它,通过添加另一列 step,然后按 step 排序来保留顺序。
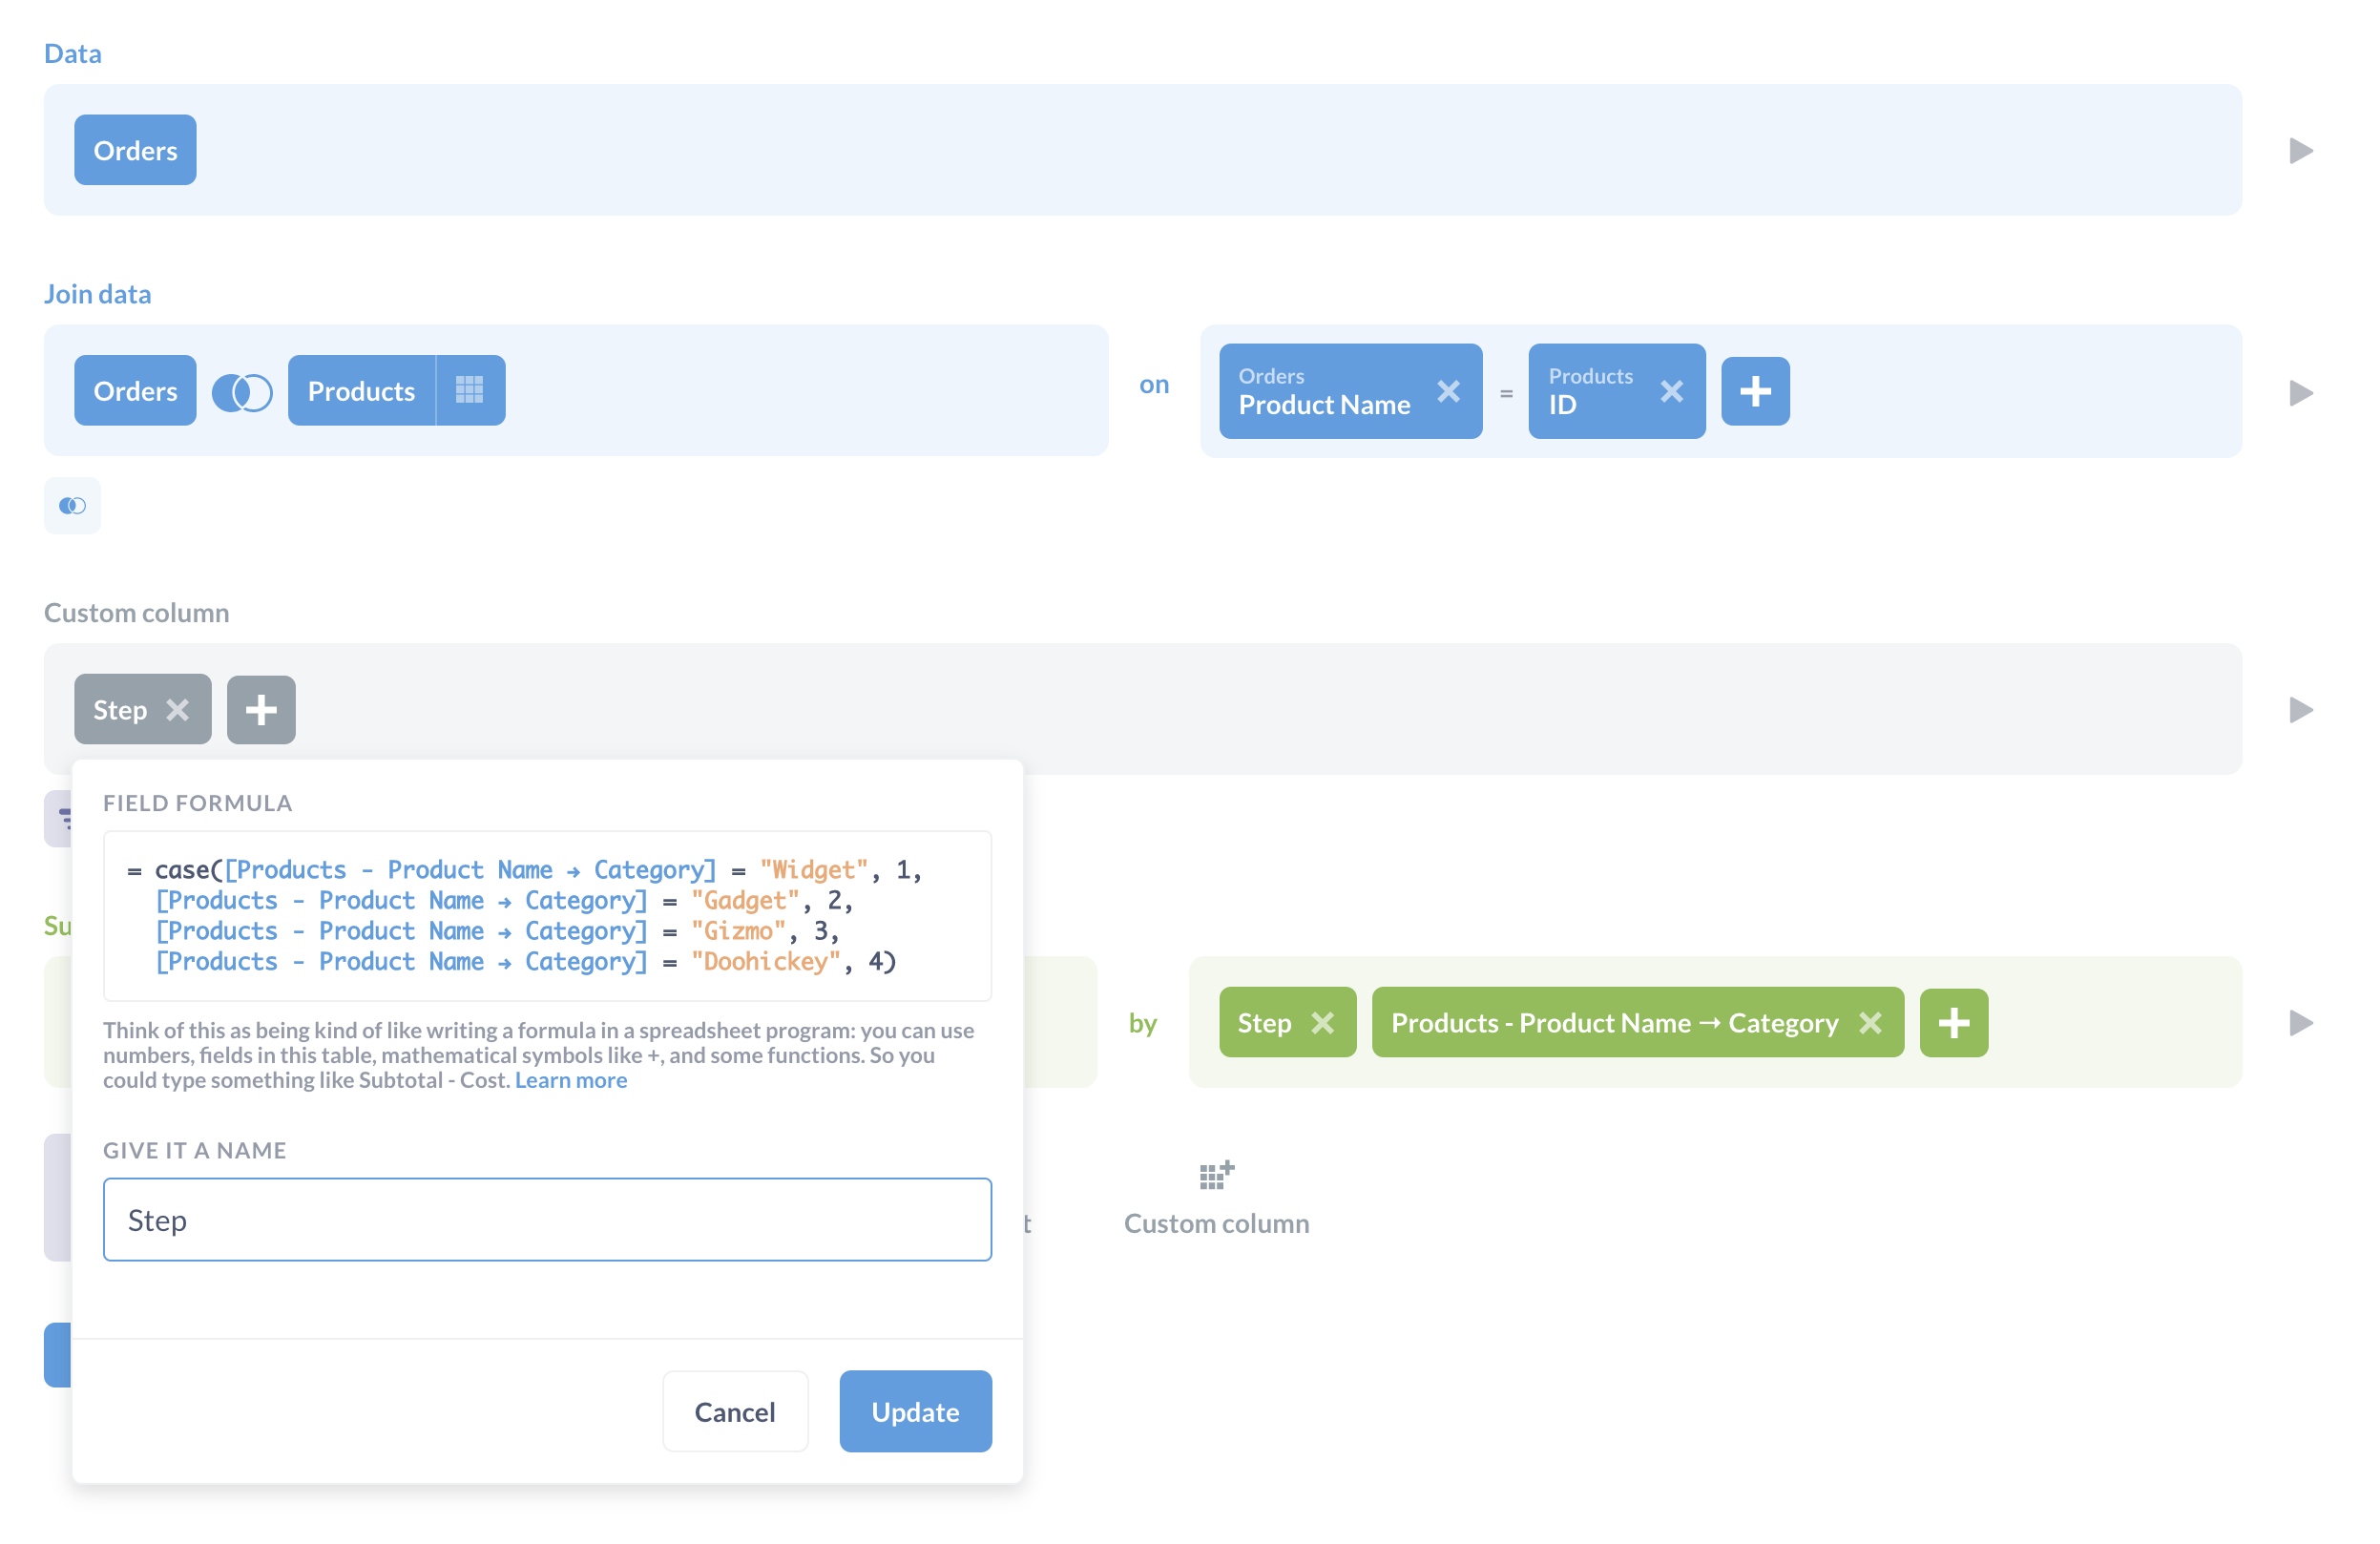
这是自定义表达式
case([Products - Product Name → Category] = "Widget", 1, [Products - Product Name → Category] = "Gadget", 2, [Products - Product Name → Category] = "Gizmo", 3, [Products - Product Name → Category] = "Doohickey", 4)
基本上,我们说 Widgets 是漏斗的步骤 1,Gadgets 是步骤 2,依此类推。
使用 SQL 的漏斗图示例
另一个使用示例数据库的虚构示例:假设我们了解到,生命周期价值最高的客户是那些从我们所有四个产品类别(Doohickeys、Gadgets、Gizmos 和 Widgets)下订单的客户。因此,对于此示例,我们想查看我们的客户如何根据他们订购的不同产品类别进行细分。
这里需要做出的一个关键区分是,我们不是要查看客户的分布,即,我们不是要查看有多少客户仅从一个产品类别订购,有多少客户从两个类别订购,等等。我们将把所有为任何类别下订单的客户作为第一步。对于下一步,我们将把该人群缩小到仅限于那些在至少两个产品类别、然后三个类别、然后四个类别下订单的人。
假设我们有一个由 100 名下过订单的客户组成的客户池。该表看起来像这样:
| Step: number of categories    | Count of customers |
|:------------------------------|:-------------------|
| Ordered from one category     | 100                |
| Ordered from two categories   | 70                 |
| Ordered from three categories | 40                 |
| Ordered from four categories  | 20                 |
我们的攻击计划:我们将使用公用表表达式将此查询分解为四个子查询,每个查询都会进一步优化我们的结果。然后我们将使用 UNION 将所有结果合并到一个结果表中。
我们将首先获取所有从我们这里订购的客户,并将该查询放入 CTE 中以构建另一个子查询。在下面的代码块中,我们将第一个子查询称为 starting_data。为了获得客户的第一个“步骤”,我们将创建一个新的子查询 cat_one,该子查询将 starting_data 的结果作为其起始数据。
WITH starting_data
     AS (SELECT people.id,
                products.category
         FROM   people
                JOIN orders
                  ON people.id = orders.user_id
                JOIN products
                  ON orders.product_id = products.id
         GROUP  BY people.id,
                   products.category
         ORDER  BY people.id),
     cat_one
     AS (SELECT id,
                Count(id) AS cats
         FROM   starting_data
         GROUP  BY id
         HAVING cats > 0
         ORDER  BY id)
对于接下来的两个步骤,我们将执行相同的操作(即,逐步构建在先前结果的基础上)。
WITH starting_data
     AS (SELECT people.id,
                products.category
         FROM   people
                JOIN orders
                  ON people.id = orders.user_id
                JOIN products
                  ON orders.product_id = products.id
         GROUP  BY people.id,
                   products.category
         ORDER  BY people.id),
     cat_one
     AS (SELECT id,
                Count(id) AS cats
         FROM   starting_data
         GROUP  BY id
         HAVING cats >= 0
         ORDER  BY id),
     -- People who ordered from at least two categories
     cat_two
     AS (SELECT id,
                Count(id) AS cats
         FROM   cat_one
         GROUP  BY id
         HAVING cats > 1
         ORDER  BY id),
     -- People who ordered from at least three categories
     cat_three
     AS (SELECT id,
                Count(id) AS cats
         FROM   cat_one
         GROUP  BY id
         HAVING cats > 2
         ORDER  BY id),
     -- People who ordered from at least four categories
     cat_four
     AS (SELECT id,
                Count(id) AS cats
         FROM   cat_one
         GROUP  BY id
         HAVING cats > 3
         ORDER  BY id)
因此,现在我们有了四个结果:cat_one、cat_two、cat_three、cat_four,我们需要将这些结果合并到一个结果表中。我们将使用 UNION 来合并结果。
-- Now we union these four results to produce a single table
-- that we'll use to build our funnel chart. The table will have two columns:
-- the Step: number of categories (our step),
-- and the count of customers (our measure).
SELECT 'Ordered from one category' AS "Step: number of categories",
       Count(*)                    AS Customers
FROM   cat_one
UNION
SELECT 'Ordered from two categories' AS "Step: number of categories",
       Count(*)                      AS Customers
FROM   cat_two
UNION
SELECT 'Ordered from three categories' AS "Step: number of categories",
       Count(*)                        AS Customers
FROM   cat_three
UNION
SELECT 'Ordered from four categories' AS "Step: number of categories",
       Count(*)                       AS Customers
FROM   cat_four
ORDER  BY customers DESC
漏斗图查询
这是完整查询
WITH starting_data
     AS (SELECT people.id,
                products.category
         FROM   people
                JOIN orders
                  ON people.id = orders.user_id
                JOIN products
                  ON orders.product_id = products.id
         GROUP  BY people.id,
                   products.category
         ORDER  BY people.id),
     cat_one
     AS (SELECT id,
                Count(id) AS cats
         FROM   starting_data
         GROUP  BY id
         HAVING cats >= 0
         ORDER  BY id),
     -- People who ordered from at least two categories
     cat_two
     AS (SELECT id,
                Count(id) AS cats
         FROM   cat_one
         GROUP  BY id
         HAVING cats > 1
         ORDER  BY id),
     -- People who ordered from at least three categories
     cat_three
     AS (SELECT id,
                Count(id) AS cats
         FROM   cat_one
         GROUP  BY id
         HAVING cats > 2
         ORDER  BY id),
     -- People who ordered from at least four categories
     cat_four
     AS (SELECT id,
                Count(id) AS cats
         FROM   cat_one
         GROUP  BY id
         HAVING cats > 3
         ORDER  BY id)
-- Now we union these four results to produce a single table
-- that we'll use to build our funnel chart. The table will have two columns:
-- the Step: number of categories (our step),
-- and the count of customers (our measure).
SELECT 'Ordered from one category' AS "Step: number of categories",
       Count(*)                    AS Customers
FROM   cat_one
UNION
SELECT 'Ordered from two categories' AS "Step: number of categories",
       Count(*)                      AS Customers
FROM   cat_two
UNION
SELECT 'Ordered from three categories' AS "Step: number of categories",
       Count(*)                        AS Customers
FROM   cat_three
UNION
SELECT 'Ordered from four categories' AS "Step: number of categories",
       Count(*)                       AS Customers
FROM   cat_four
ORDER  BY customers DESC
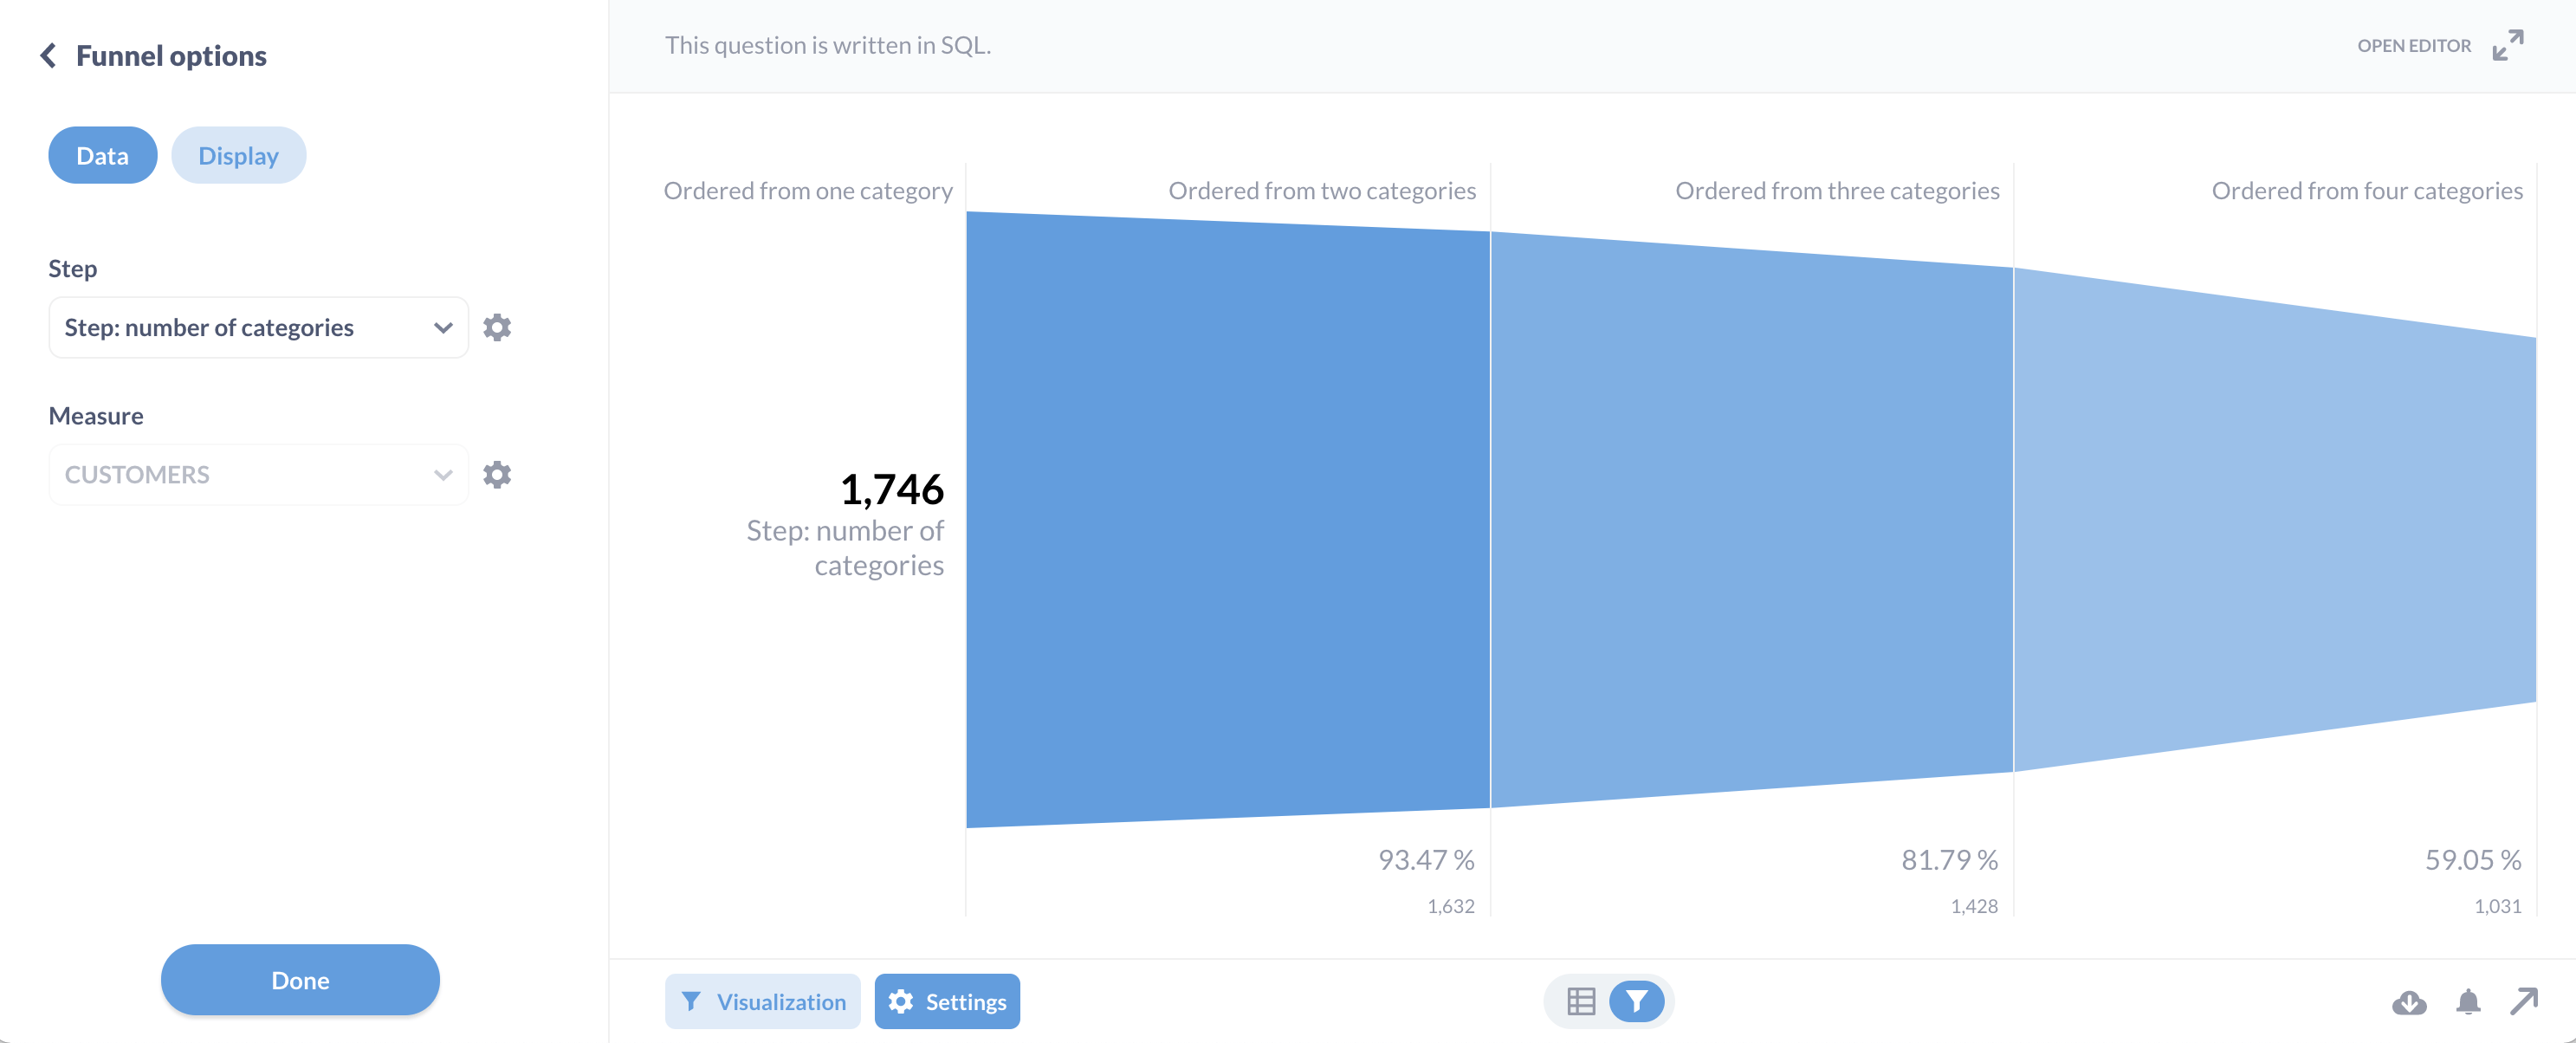
这应该产生:
| Step: number of categories    | CUSTOMERS |
|-------------------------------|-----------|
| Ordered from one category     | 1,746     |
| Ordered from two categories   | 1,632     |
| Ordered from three categories | 1,428     |
| Ordered from four categories  | 1,031     |
现在我们所要做的就是在左下方点击可视化,然后选择漏斗。
如果您打开设置选项卡,您可以更改步骤或度量。在显示选项卡中,您可以将图表从漏斗图更改为条形图(但如上所述,您将失去视觉隐喻和度量相对于第一步的百分比)。
在 SQL 中保持步骤排序
就像上面使用查询构建器一样,为了强制执行步骤顺序,您可以添加一个额外的列(我们将其称为“step”
SELECT 'Ordered from one category' AS "Step: number of categories",
       Count(*)                    AS Customers,
       1 as step
FROM   cat_one
UNION
SELECT 'Ordered from two categories' AS "Step: number of categories",
       Count(*)                      AS Customers,
       2 as step
FROM   cat_two
UNION
SELECT 'Ordered from three categories' AS "Step: number of categories",
       Count(*)                        AS Customers,
       3 as step
FROM   cat_three
UNION
SELECT 'Ordered from four categories' AS "Step: number of categories",
       Count(*)                       AS Customers,
       4 as step
FROM   cat_four
ORDER  BY step


